Know what needs attention
See crops, rooms, fields, blocks, tasks, alerts, lab results, and harvest progress from one working view.
Quality risk in Block B is rising — decomposed into the factors actually driving it, from your own crop history.
Most farms already have data in too many places: notebooks, spreadsheets, sensors, lab reports, weather tools, photos, and people’s heads. AgrolandCompass turns that into a daily operating system for crop decisions.
See crops, rooms, fields, blocks, tasks, alerts, lab results, and harvest progress from one working view.
Track climate, weather, irrigation, nutrition, scouting notes, and quality signals before small issues become losses.
Ask why a zone, field, cycle, or variety underperformed and see which factors — climate, water, nutrition, crop choice, interventions — actually drove the result, ranked and decomposed from your own crop history. No black box.
Use it for daily monitoring, observations, lab results, issue tracking, harvest reviews, and agronomic questions. The same product adapts to different crops and to both controlled environments and open fields.
Rooms, recipes, substrate, fertigation, lighting, CO₂, climate control, biological control, sensors, and crop cycles.
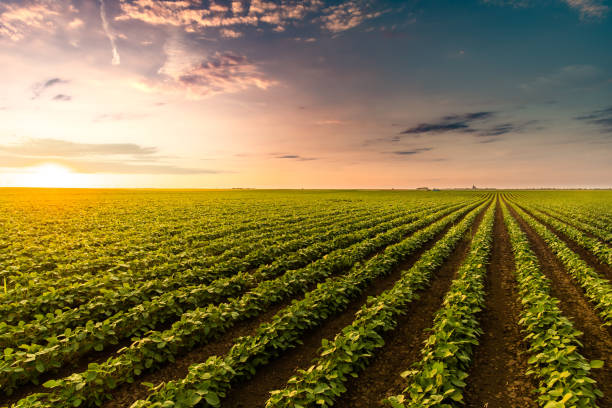
Fields, blocks, weather, soil, irrigation, imagery, scouting, and seasonal progress.
Each crop can have its own stages, varieties, quality targets, pests, diseases, and lab measures.
AgrolandCompass connects the crop and business data you already have to scientific models and AI — to not only monitor, but identify causal relationships and optimize concrete decisions. The same engine ships as three specialized solutions, each tuned to a market and proven on real data.
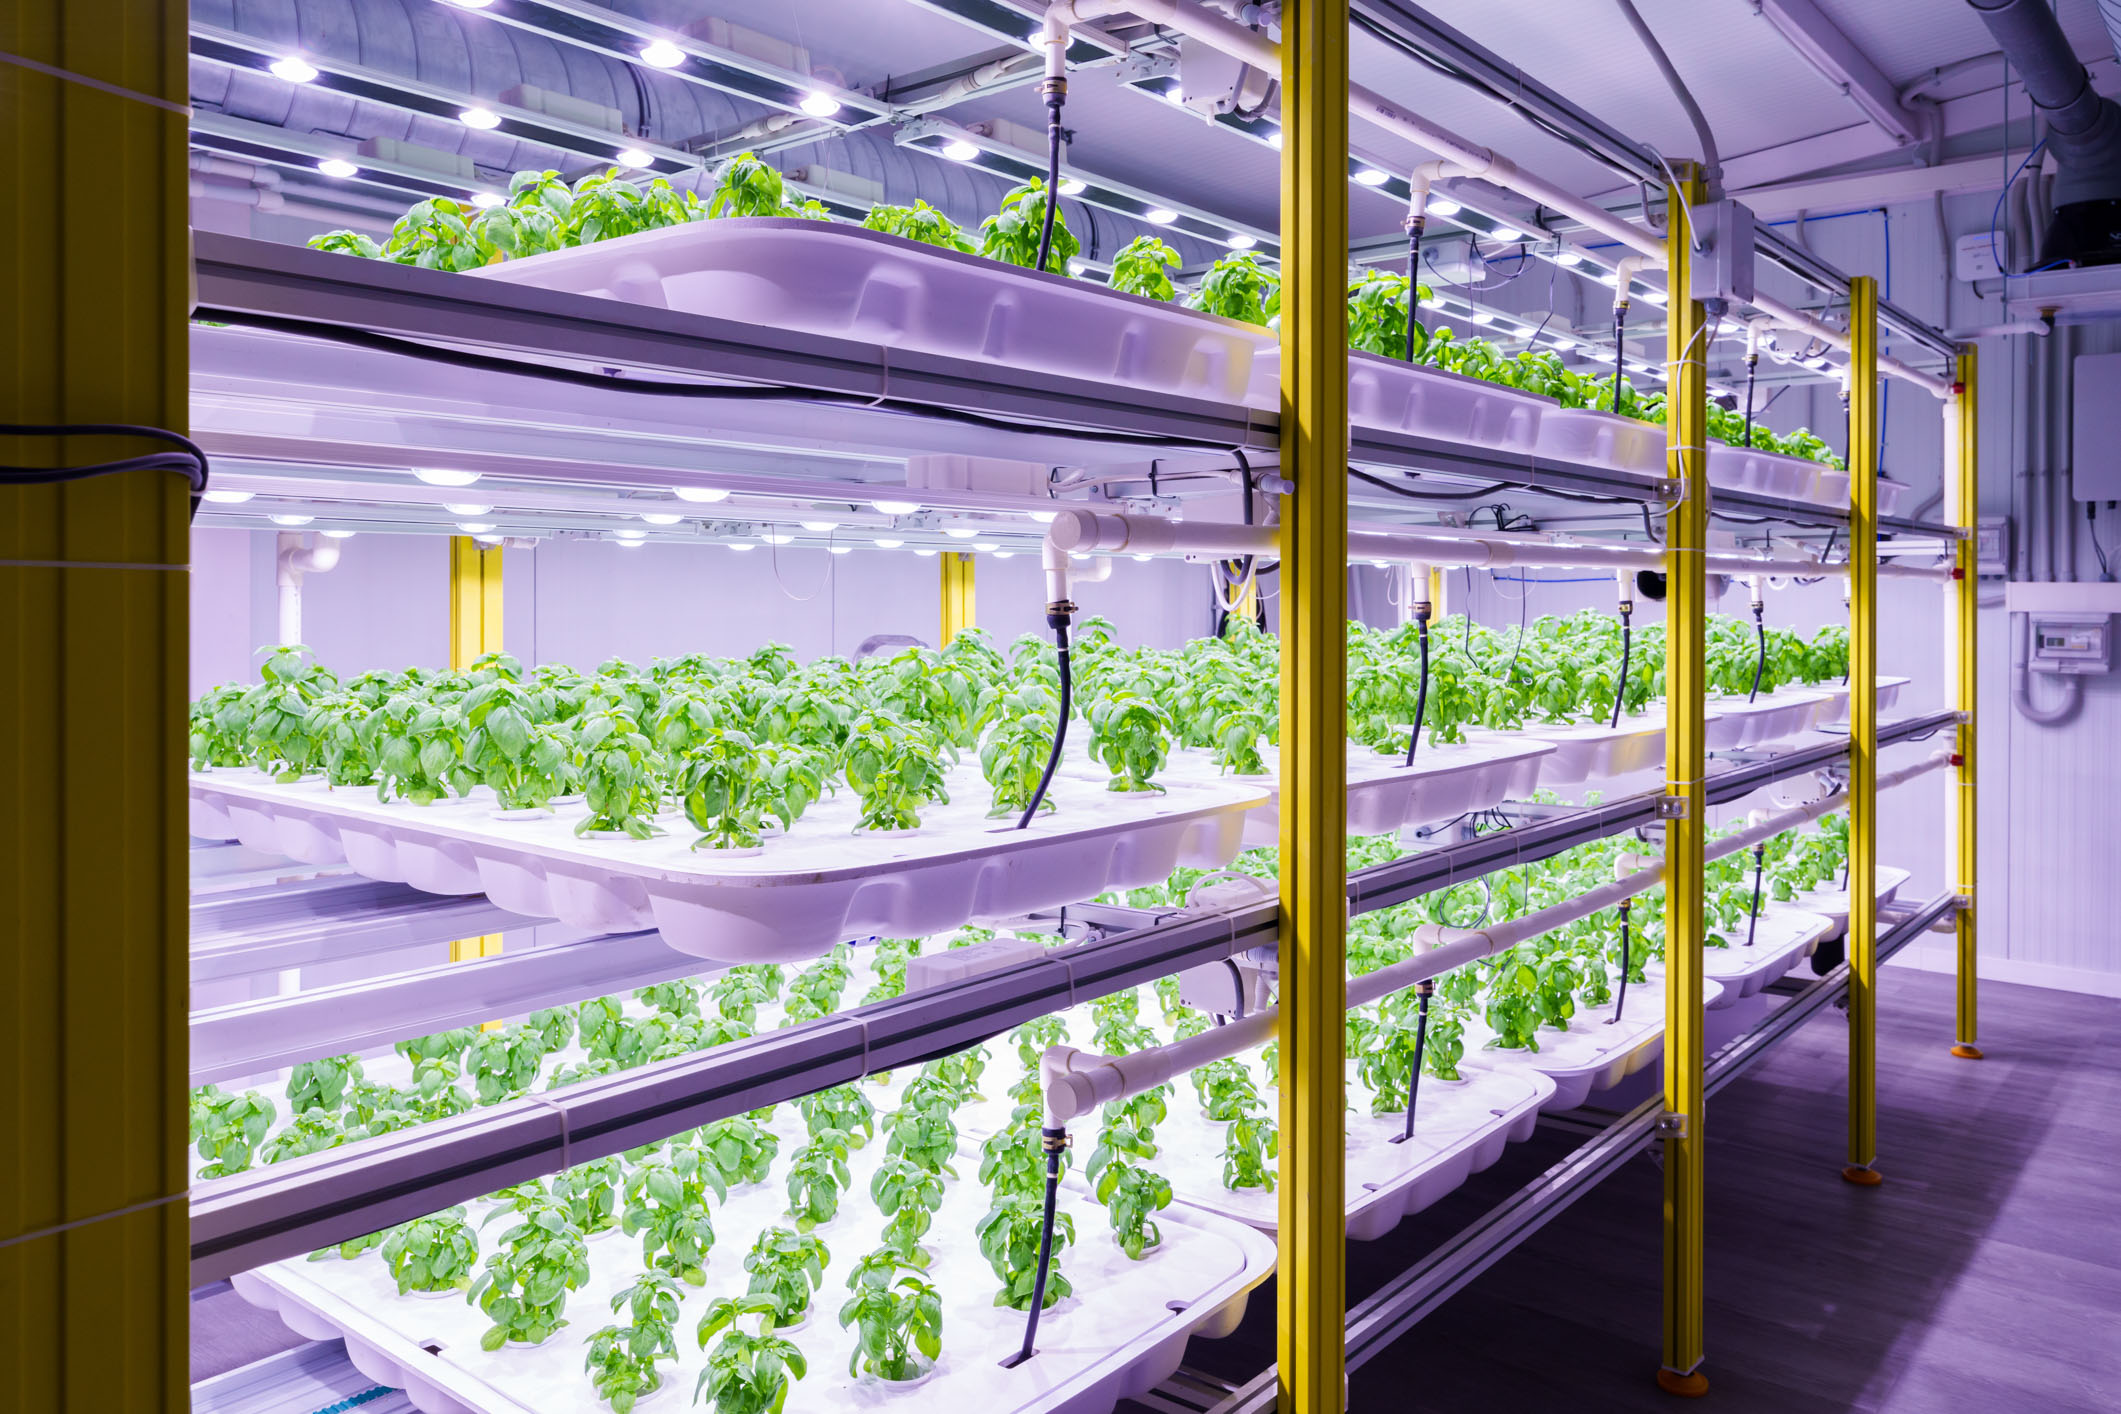
For closed-loop indoor and greenhouse ecosystems.
Find the crop mix and planting calendar that maximizes profit against your energy budget. Thousands of simulations weigh growing times, energy use, and seasonal prices for your greenhouse.
Know which beneficial insects to release, when, and how many. We simulate predator–prey dynamics for your climate so you spray less and still protect the crop.
A complete view of energy, water, land, and carbon efficiency using peer-reviewed methodology — ready for the data your customers will soon require.
For macro-level regional and policy scenario modeling.
Model land-use, crop-mix, and input scenarios at regional scale to see the macro trade-offs before committing public resources.
Weigh emissions, water, food output, and economic impact side by side, so public decisions rest on transparent evidence instead of assumptions.
EROI, emissions, and resource balances aggregated across a region — the audit-ready basis for public reporting, proven with the Menorca municipality.
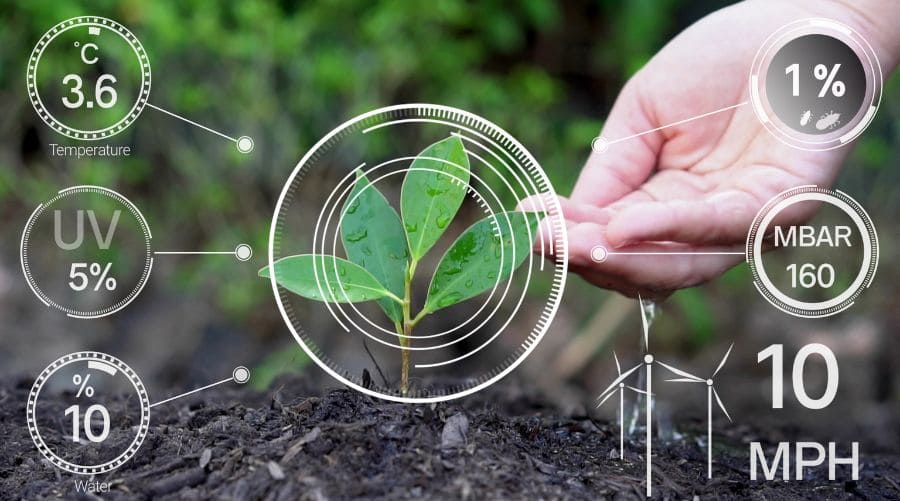
For progressive open-air, broad-acre farming.
Cut nitrogen field by field without losing profit. The optimizer shows exactly where to reduce and why, so you meet reduction targets and stay compliant.
Generate EROI, emissions, and N/P balance automatically for CAP eco-schemes — defensible, audit-ready numbers without paying a consultant per report.
Find the most profitable crop allocation for your land, balancing market prices, input costs, rotation rules, water, and sustainability targets at once.
AgrolandCompass connects to the farm systems, maps, sensors, and lab tools you already use — like FarmMaps and Akkerland, climate and fertigation controllers, weather feeds, and lab reports. Your data flows in instead of being re-entered, which is why a typical implementation goes live in about four weeks.
Bring in fields, plots, crops, and registrations from the farm management platforms your team already works in.
Connect climate computers, fertigation, soil and in-room sensors, and weather feeds so monitoring stays current automatically.
Pull in lab results, satellite and drone imagery, spreadsheets, and scouting records without re-keying them by hand.
Link the farm systems, sensors, files, and feeds your team already works with.
Match your sites, crops, rooms, fields, and cycles to how you actually run them.
Start daily monitoring and answers — typically within about four weeks.
A clear morning picture of crop status, what changed since yesterday, which zones need attention, what the team should do, and which decisions are affecting yield and quality over time.
Know which crop, room, field, block, or lot needs attention first.
Relate lab results and harvest outcomes back to climate, water, nutrition, and interventions.
Turn grower intuition into hypotheses that can be checked against real crop history.
Capture notes, evidence, findings, and playbooks so know-how does not live only in one person’s head.
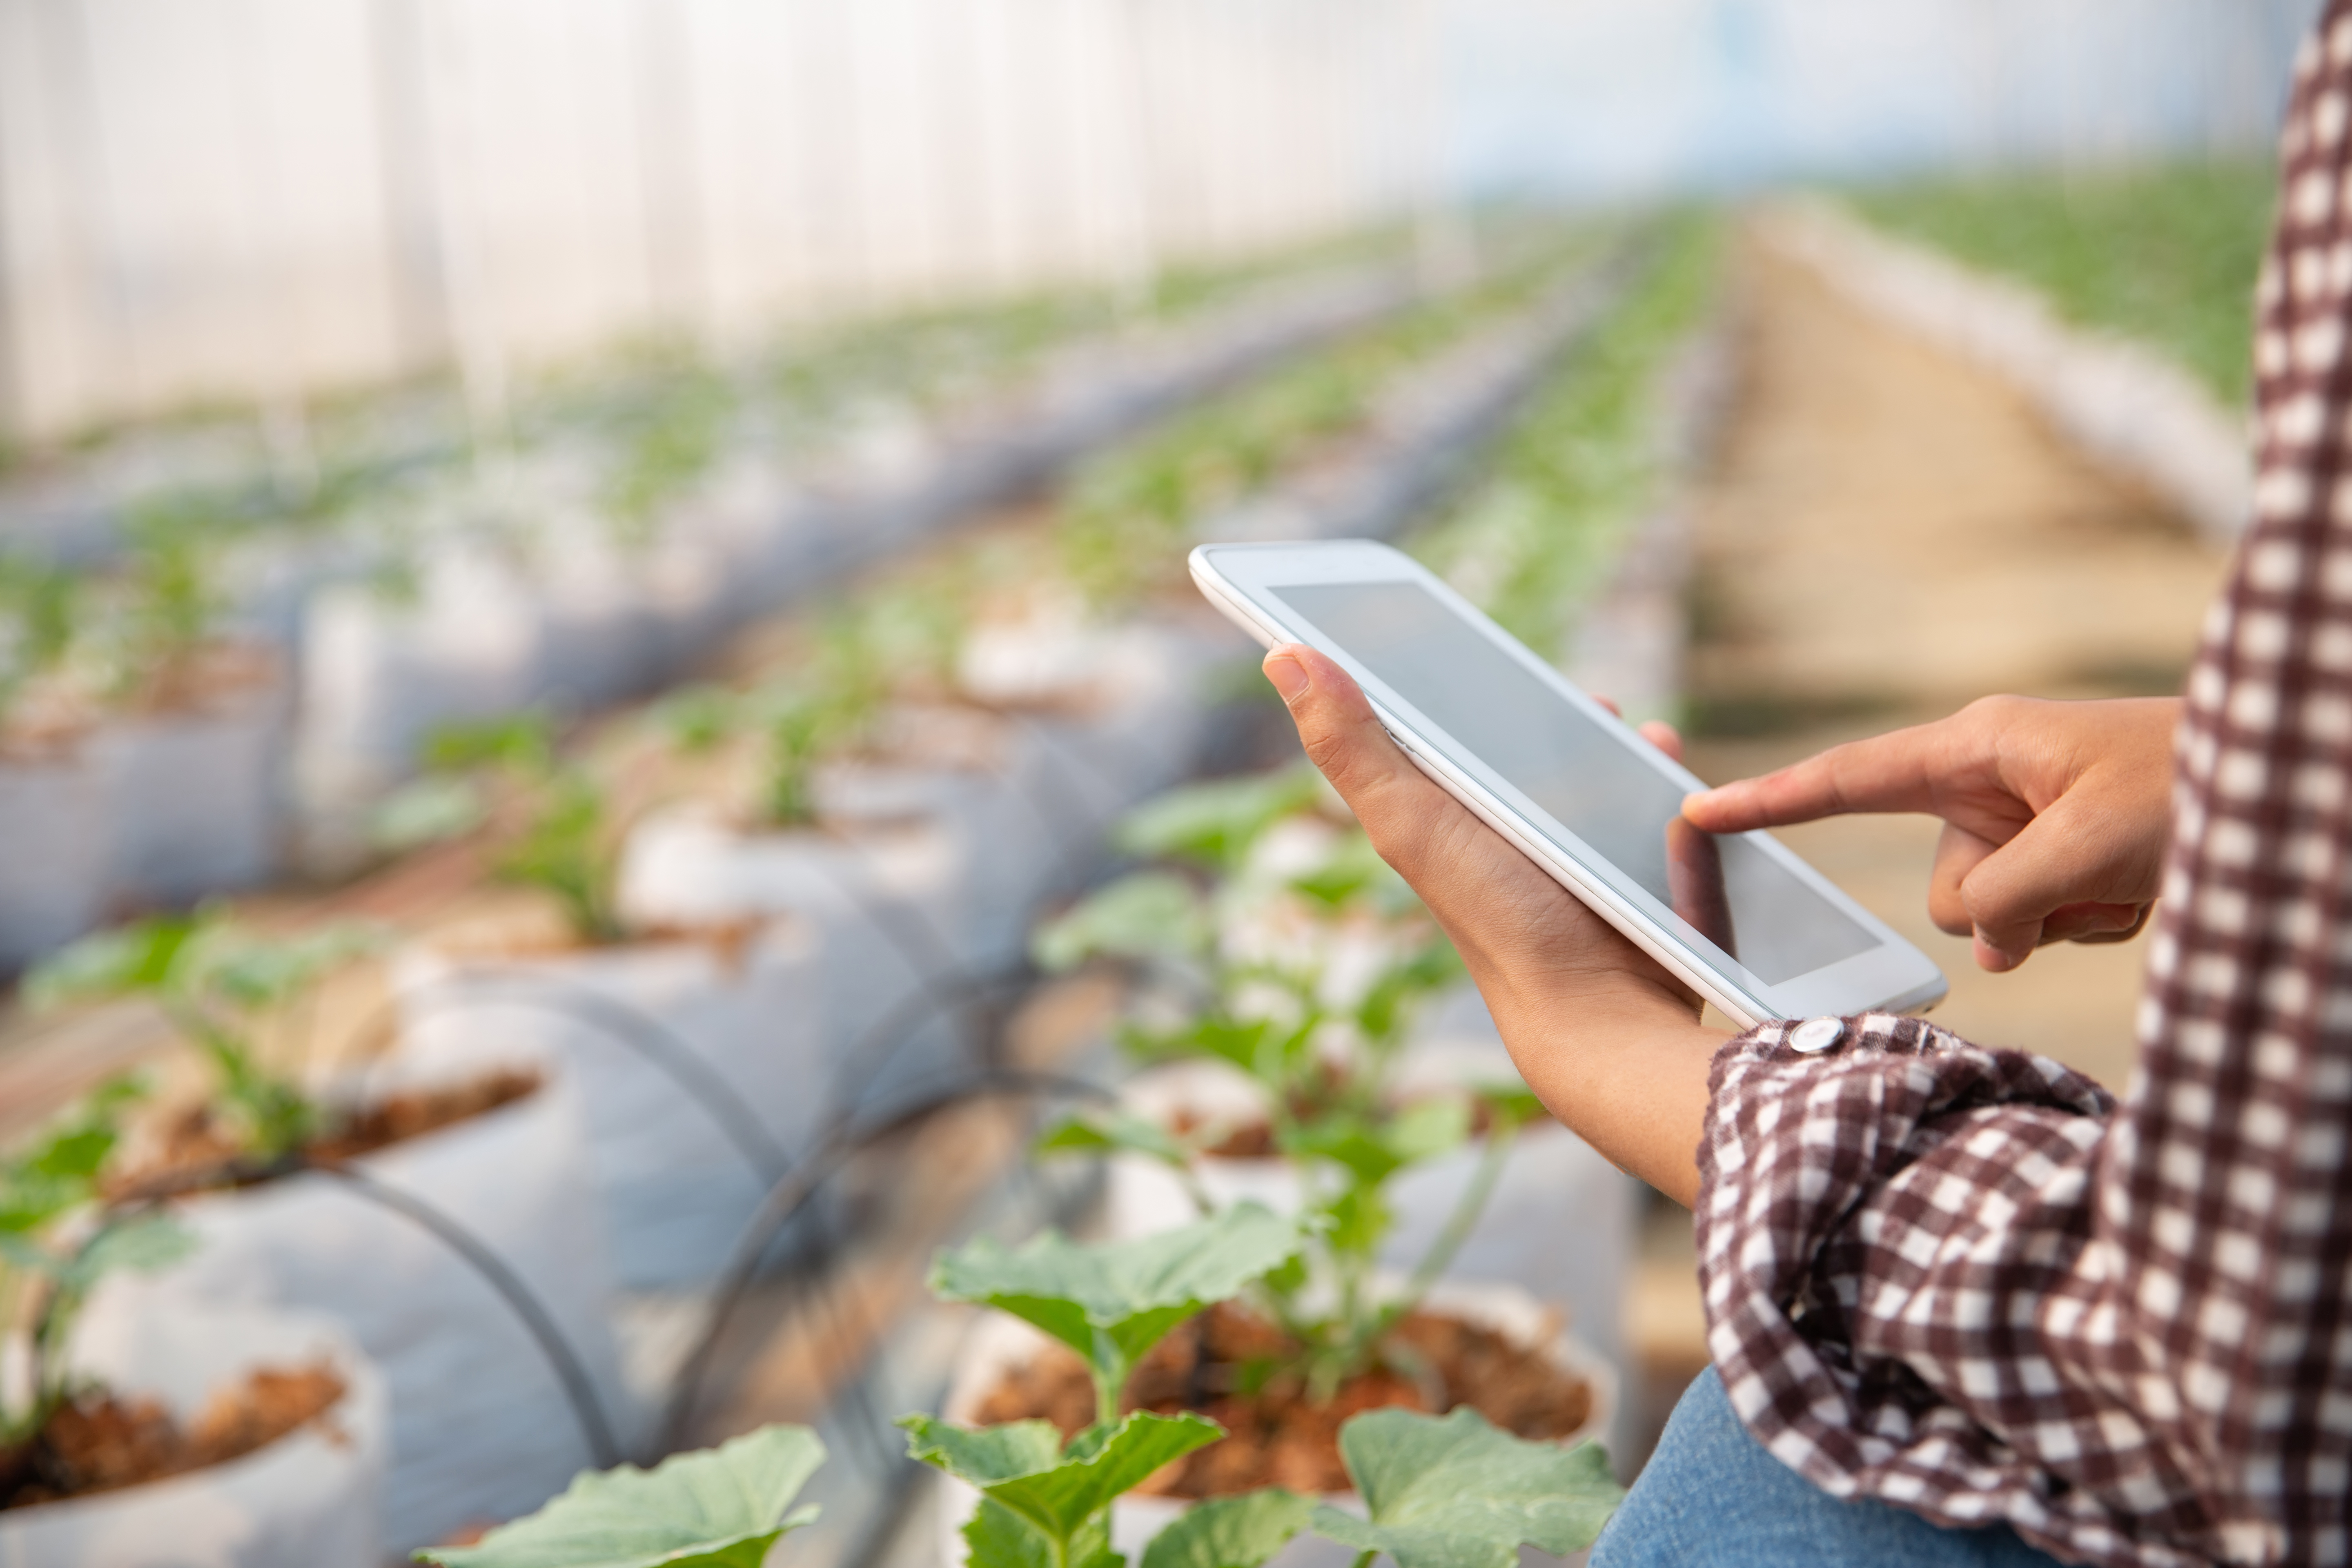
Check today’s priorities, log scouting notes, and capture photos right at the plant — from your phone or tablet, without going back to the office.
The optimization, energy-return, and explainable-decomposition methods behind AgrolandCompass come from years of academic research — peer-reviewed and presented at international conferences (ICCS).
Built on research carried out at the Universitat Autònoma de Barcelona, where the underlying methods were developed and published.
Applied with the Menorca municipality on real regional data to inform public-policy decisions.
Already built and running for Ekonoke, an indoor grower producing hops for the beer industry — not a theoretical product.
We will use your message to prepare a focused conversation around your crop operation, data sources, team workflows, and the decisions you want to improve.